
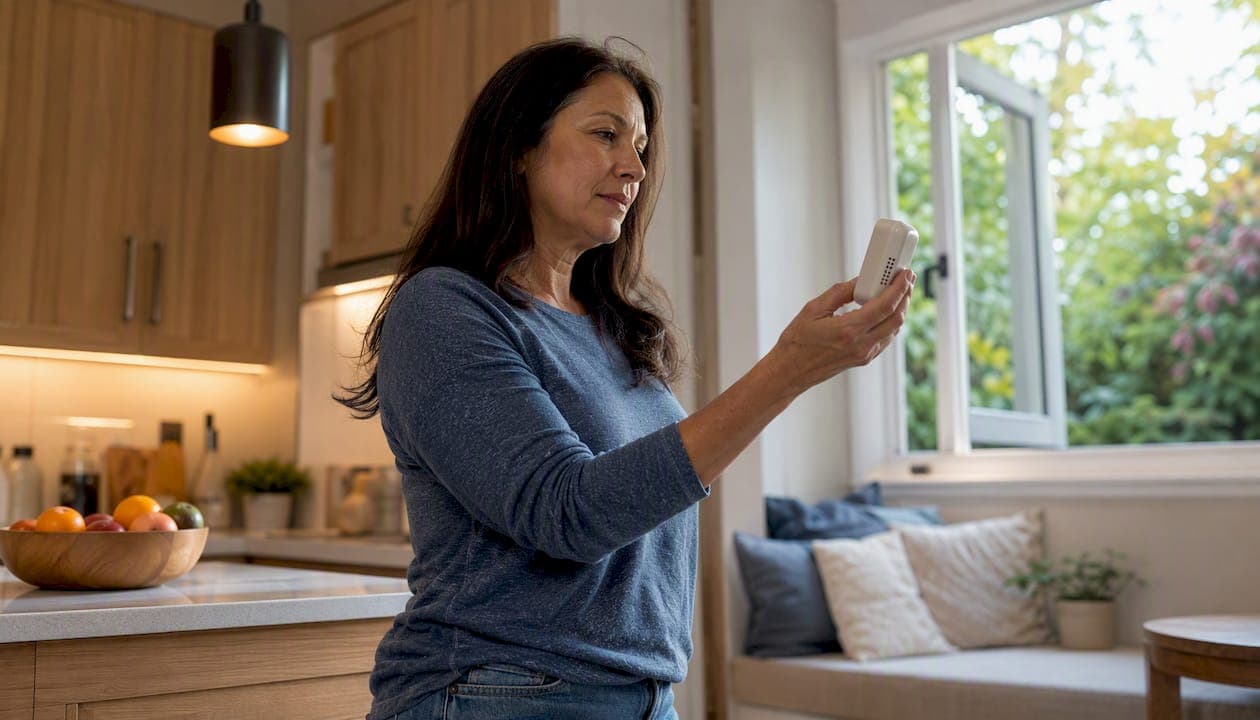
The ten air quality factors to monitor first are PM2.5, PM10, ozone (O3), nitrogen dioxide (NO2), sulfur dioxide (SO2), carbon monoxide (CO), volatile organic compounds (VOCs), carbon dioxide (CO2), radon, and biological contaminants such as mold spores and allergens. WHO guidance confirms that continuous monitoring, not a single snapshot, is what actually reveals the sources driving your exposure.
Indoor priorities (start here):
- CO: install a detector on every floor; evacuate immediately if it alarms
- Radon: test regularly, especially in basements and ground-floor rooms
- PM2.5 and VOCs: run a multi-parameter monitor continuously in the main living area
- CO2: use as a ventilation proxy; elevated readings signal inadequate air exchange
- Humidity: keep between 30% and 50% to suppress mold and dust mites
Outdoor priorities:
- Check the U.S. AQI on AirNow daily during wildfire season, summer ozone peaks, and winter inversions
- PM2.5 and O3 are the two outdoor pollutants most likely to affect your health on any given day
- NO2 and SO2 matter most near highways, industrial zones, or during high-traffic commute hours
Immediate actions by risk level:
- AQI above moderate risk outdoors: close windows, run HVAC with a clean filter, limit outdoor time
- CO alarm: leave the building, call 911, do not re-enter until cleared
- Radon above recommended action level: contact a certified mitigation contractor
Table of Contents
- What do AQI numbers actually mean?
- Which pollutants and environmental factors should you track?
- How can you tell if your home's air quality is poor?
- How do you choose and place an air quality monitor?
- How do you turn monitor readings into real actions?
- When and how often should you monitor?
- What does monitoring cost, and when should you hire a professional?
- Why HVAC maintenance directly affects what your monitor reads
- Key Takeaways
- The part most monitoring guides skip
- Clean air in Avondale starts with what's inside your ducts
- Useful sources and further reading
- FAQ
What do AQI numbers actually mean?
The U.S. Air Quality Index is published by the EPA and AirNow and runs in a scale representing air pollution risk. It translates raw pollutant concentrations into a single number tied to a color-coded health category. The index covers six pollutants: PM2.5, PM10, ozone, CO, NO2, and SO2. On any given day, the reported AQI reflects whichever pollutant is highest.
Raw concentrations are measured in micrograms per cubic meter (µg/m³) for particles, or parts per billion (ppb) and parts per million (ppm) for gases. The AQI converts those units into a 0–500 scale so a non-scientist can act on the number without doing the math.
| AQI Range | Category | Who Should Act |
|---|---|---|
| 0–50 | Good | No action needed |
| 51–99 | Moderate | Unusually sensitive people should limit prolonged outdoor exertion |
| 101–150 | Unhealthy for Sensitive Groups | Children, elderly, and people with asthma or heart disease should reduce outdoor activity |
| 151–200 | Unhealthy | Everyone should limit prolonged outdoor exertion |
| 201–299 | Very Unhealthy | Everyone should avoid outdoor exertion |
| 301–500 | Hazardous | Everyone should stay indoors with windows closed |
When AQI crosses 100, sensitive groups need to change behavior. When it crosses 150, everyone does. The CDC notes that PM2.5 at elevated concentrations is linked to heart attacks, strokes, asthma exacerbations, and early death, which is why the index is designed to trigger action before concentrations reach acutely dangerous levels.
The AQI is a short-term risk tool. A day at 120 is not the same health burden as six months averaging 120. That distinction matters when you are deciding between a behavioral change today and a structural fix to your home's ventilation.
Which pollutants and environmental factors should you track?
The EPA regulates six criteria air pollutants, but indoor environments add several more that outdoor monitoring misses entirely. Here is what each one is, where it comes from, and why it belongs on your list.
PM2.5 and PM10
PM2.5 (particles smaller than 2.5 micrometers) penetrates deep into the lungs and enters the bloodstream. PM10 (up to 10 micrometers) irritates the upper airways. AirNow's particle guide identifies combustion, wildfires, and industrial activity as primary outdoor sources. Indoors, cooking, candles, and dirty ductwork are the main culprits. PM2.5 is the single most important parameter to monitor continuously.
Ozone (O3)
Ground-level ozone forms when sunlight reacts with vehicle exhaust and industrial emissions. The National Weather Service explains that hot, sunny, calm days produce the worst ozone peaks, typically in the afternoon. Ozone irritates the respiratory tract and can trigger asthma attacks even in people who have never been diagnosed.
Nitrogen dioxide (NO2)
NO2 comes from vehicle exhaust, gas stoves, and furnaces. Indoors, a gas range without an exhaust fan can push NO2 to levels that irritate airways within minutes of cooking. Outdoors, it is a marker for traffic-related pollution.
Sulfur dioxide (SO2)
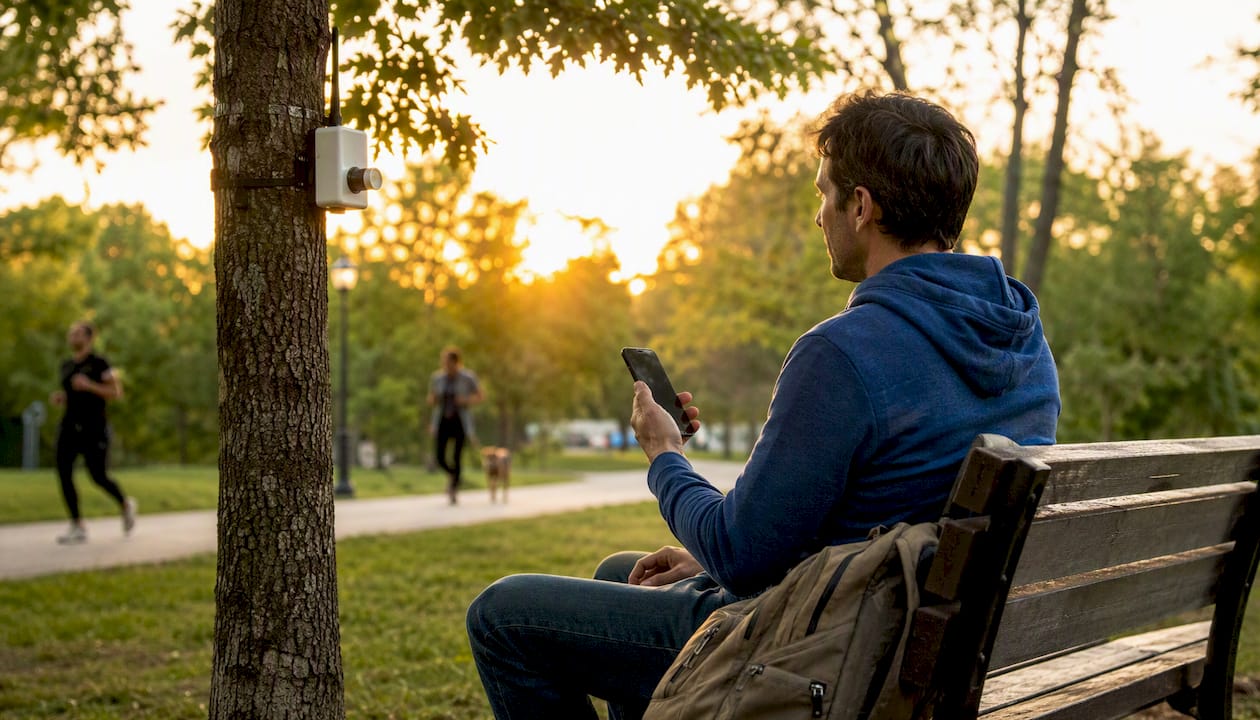
SO2 is primarily an outdoor concern near power plants and industrial facilities. It aggravates asthma and contributes to particle formation. Most residential monitors do not include SO2 sensors, so the AirNow daily AQI is your practical tool for tracking it.
Carbon monoxide (CO)
CO is colorless, odorless, and acutely dangerous. Sources include gas appliances, furnaces, fireplaces, and attached garages. A dedicated CO detector is non-negotiable in any home with combustion appliances. At high concentrations, CO causes unconsciousness and death within minutes.
Volatile organic compounds (VOCs)
VOCs off-gas from paints, adhesives, cleaning products, furniture, and flooring. The CPSC's indoor air quality guide lists building materials and household products as primary indoor sources. Consumer VOC sensors report a broad TVOC (total VOC) reading rather than individual compounds, which limits their diagnostic precision but still flags elevated events.
Carbon dioxide (CO2)
CO2 itself is not toxic at typical indoor levels, but it is the best proxy for ventilation adequacy. When CO2 climbs above 1,000 ppm, it signals that fresh air exchange is insufficient, which means other pollutants are also accumulating. NIEHS research confirms that inadequate ventilation is a leading driver of elevated indoor pollutant concentrations, particularly in tightly sealed, energy-efficient homes.
Radon
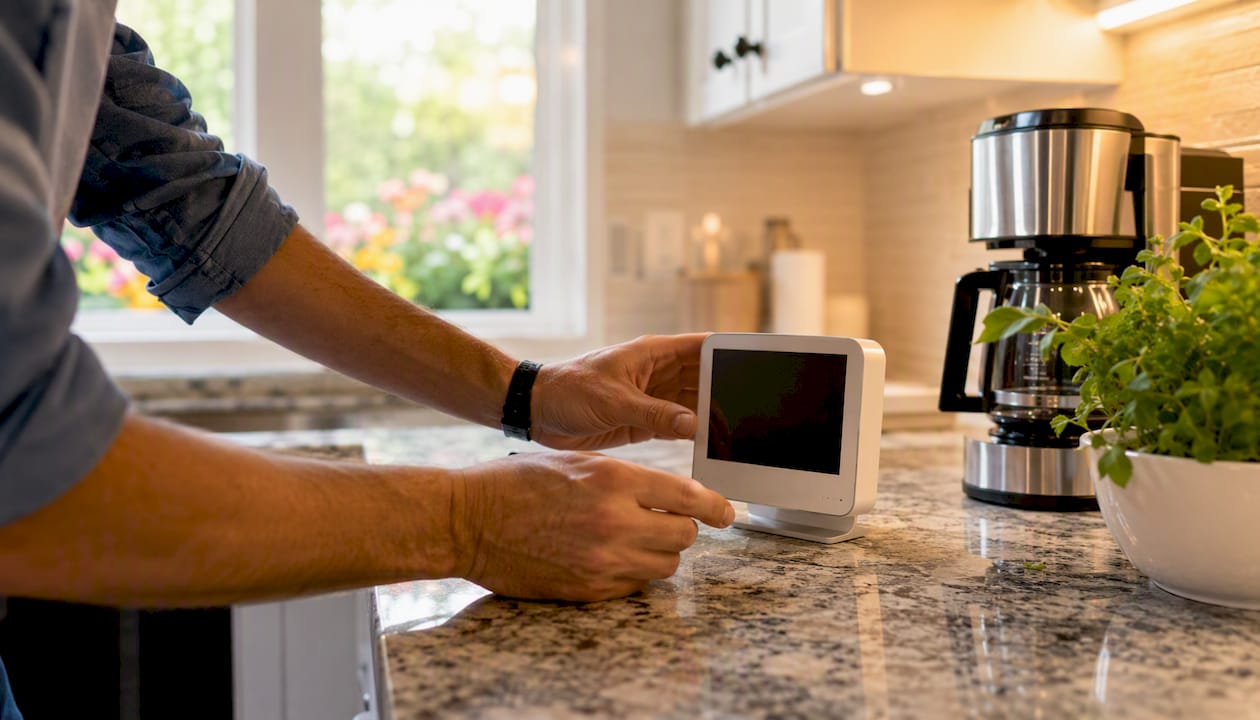
Radon is a radioactive gas that seeps from soil and rock into basements and ground-floor spaces. It is colorless and odorless, and the CPSC recommends testing every home because it is the second leading cause of lung cancer in the United States. The EPA action level is 4 picocuries per liter (pCi/L).
Biologicals and allergens
Mold spores, dust mites, pet dander, and pollen are not gases or particles in the traditional AQI sense, but they are major drivers of respiratory symptoms. Humidity above 60% accelerates mold growth. Ductwork that has never been cleaned can harbor mold colonies that distribute spores throughout the home every time the HVAC runs.
Indoor environmental factors: ventilation, humidity, and combustion sources
Beyond individual pollutants, three environmental conditions shape everything else:
- Ventilation rate: measured as air changes per hour (ACH). Low ACH lets every pollutant concentrate.
- Relative humidity: the 30%–50% range suppresses mold and dust mites without drying out airways.
- Combustion appliances: gas stoves, fireplaces, and unvented space heaters are the most common sources of CO, NO2, and fine particles indoors.
Pro Tip: Place sensors at breathing height (roughly 3–5 feet off the floor), at least 3 feet from windows and exterior doors, and never directly above a stove or next to an HVAC supply vent. A sensor next to a supply vent reads filtered air, not room air, and will consistently underreport. Spikes immediately after cooking or showering are normal; a reading that stays elevated 30 minutes after the activity ends points to a real ventilation problem.
How can you tell if your home's air quality is poor?
You do not always need a monitor to spot a problem. Many indoor air quality issues announce themselves through physical symptoms and visible clues before any device confirms them.
- Persistent musty or chemical odors that do not clear after ventilating. Musty smells suggest mold or biological growth; sharp chemical smells often indicate off-gassing VOCs from new materials or cleaning products.
- Condensation on interior windows in cold weather, especially in multiple rooms. This signals humidity above 60% and creates conditions where mold grows inside walls and ductwork.
- Visible dust accumulation near vents within days of cleaning. Dusty supply registers are a strong indicator that ductwork is distributing particulates through the home.
- Recurring headaches, fatigue, or eye irritation that improve when you leave the house for a few hours. The EPA identifies this pattern as a classic sign of indoor air quality problems rather than an external cause.
- Mold visible on walls, ceilings, or around window frames. Visible mold is always the tip of the iceberg; the colony inside the wall or duct is typically larger.
- Symptoms that track with specific activities: headaches after cooking on a gas stove (NO2/CO), dizziness in the garage (CO from a running car), or sneezing that spikes when the HVAC turns on (ductwork allergens).
When to use a device vs. when to call a professional:
- Start with a consumer monitor if symptoms are mild and intermittent, or if you want baseline data before making any changes.
- Call a professional for indoor air quality testing when symptoms are persistent, when you suspect CO or radon, when mold is visible, or when a monitor shows consistently elevated readings you cannot explain.
- An HVAC inspection is warranted whenever symptoms correlate with system operation, visible dust accumulates rapidly, or odors emerge from supply vents.
How do you choose and place an air quality monitor?
The right monitoring approach depends on what you are trying to solve. A household with no known issues needs something different from one where a family member has asthma.
Device categories
Consumer multi-parameter monitors (such as those from Airthings or IQAir) measure PM2.5, CO2, VOCs, humidity, and temperature in a single unit. They are the most practical starting point for most homes. Single-parameter detectors, meaning standalone CO alarms and radon monitors, are cheaper and purpose-built for the two pollutants where a missed reading is life-threatening. Outdoor air quality apps tied to the AirNow network give you real-time AQI data without any hardware purchase.
Professional testing services use laboratory-grade equipment and certified technicians. They are the right call when you need legally defensible results, when you are investigating a specific health complaint, or when consumer sensors have flagged something you cannot resolve.
What sensors actually measure
- Optical particle counters (used for PM2.5/PM10): count particles by laser light scatter. Accurate for relative comparisons; less precise for absolute concentration without factory calibration.
- Electrochemical sensors (CO, NO2): reliable for detecting dangerous spikes but drift over time and need periodic replacement.
- NDIR sensors (CO2): the most accurate consumer-grade technology for CO2; stable over years with minimal calibration.
- Photoionization detectors (PID) (VOCs): sensitive but non-specific; they report total VOC load, not individual compounds.
- Ionization chamber radon detectors: passive and slow (up to 30 days to stabilize); more accurate than electret detectors for long-term averages.
Airthings notes that VOC and CO2 sensors typically need about one week to stabilize after first use, and radon sensors can take up to 30 days to produce a reliable reading.
Placement rules
- Bedroom: place on a nightstand or dresser at breathing height. This is where you spend the most consecutive hours, so it captures your highest-dose exposure.
- Kitchen: mount on a wall at least 10 feet from the stove. Cooking spikes are expected; you want to see how quickly they clear.
- Living room: center of the room, away from exterior walls and HVAC vents.
- Basement: dedicated radon monitor at floor level, away from sump pumps and exterior doors.
Buying criteria to check before purchasing:
- Parameters measured (at minimum: PM2.5, CO2, VOCs, humidity, temperature)
- Continuous data logging with app or cloud access so you can review trends, not just current readings
- Stated accuracy and calibration interval for each sensor type
- Indoor vs. outdoor rating (outdoor units need weatherproofing and UV resistance)
- Battery backup so the monitor keeps running during power outages
For a broader look at device options, the HVAC air quality devices guide covers both residential and commercial use cases.
How do you turn monitor readings into real actions?
Numbers without a response plan are just data. The table below maps common reading ranges to specific actions.
| Pollutant / Parameter | Reading | Recommended Action |
|---|---|---|
| PM2.5 (AQI) | 0–50 | No action |
| PM2.5 (AQI) | 51–99 | Sensitive groups reduce outdoor exertion |
| PM2.5 (AQI) | 101–150 | Run HVAC with HEPA-rated filter; limit outdoor time for sensitive groups |
| PM2.5 (AQI) | 151+ | Close windows, run air purifier, everyone limits outdoor activity |
| CO2 (ppm) | Below 1,000 | Ventilation is adequate |
| CO2 (ppm) | 1,000–1,999 | Open windows or increase mechanical ventilation |
| CO2 (ppm) | Above 1,999 | Ventilate immediately; investigate HVAC performance |
| CO (ppm) | Any alarm | Evacuate immediately, call 911 |
| Radon (pCi/L) | Below 2 | No action |
| Radon (pCi/L) | 2–4 | Consider mitigation |
| Radon (pCi/L) | Above 4 | Hire a certified mitigation contractor |
| Humidity (%) | 30–50 | Ideal range |
| Humidity (%) | Above 60 | Run dehumidifier; inspect for mold |
A single high reading is not a crisis. A pattern of high readings is. WHO guidance specifically warns against acting on a single number; the goal is to identify trends that point to a persistent source.
Short-term spikes vs. chronic elevation: a PM2.5 spike during cooking that clears in 20 minutes is normal. PM2.5 that stays elevated overnight, or that is consistently high every morning before anyone cooks, points to an outdoor infiltration problem or a dirty HVAC filter distributing particles through the home.
Sensitive populations need tighter thresholds. Children, adults over 65, pregnant people, and anyone with asthma, COPD, or cardiovascular disease should treat the "Sensitive Groups" AQI category (101–150) the same way the general population treats "Unhealthy" (151–200). Their airways and cardiovascular systems respond to lower concentrations. For these households, continuous monitoring is not optional; it is the baseline.
When and how often should you monitor?
Monitoring cadence depends on what you are tracking and why.
- Continuous baseline monitoring (CO, CO2, PM2.5, radon): run 24/7 in any home with combustion appliances, a basement, or occupants with respiratory conditions. These are the parameters where a missed spike carries the highest health cost.
- Weekly spot checks for VOCs and PM after high-activity periods: after painting, cleaning with aerosol products, or bringing in new furniture. Check readings 30 minutes after the activity and again the next morning.
- Seasonal outdoor checks: pull AirNow AQI data daily during wildfire season (typically June through October in the Southwest) and during summer ozone peaks. Winter temperature inversions trap pollutants close to the ground in many U.S. cities, so check AQI on cold, still mornings before opening windows.
- Post-event checks: after a wildfire event, a remodeling project, or a flood, run your indoor PM2.5 and VOC monitor continuously for at least two weeks. Construction debris and smoke infiltration can elevate readings long after the visible event ends.
- Radon retesting: retest every two years, or after any major renovation that changes the building envelope (new windows, foundation work, basement finishing).
The National Weather Service notes that ozone peaks in the afternoon on hot, sunny days, so outdoor exercise before 10 AM or after sunset reduces exposure on high-ozone days. In Avondale, Arizona, summer heat and wildfire smoke from regional fires make afternoon AQI checks a practical daily habit from May through October.
What does monitoring cost, and when should you hire a professional?
Consumer multi-parameter monitors and professional testing services vary in cost depending on features and scope. Radon testing is affordable and recommended for homes.
Hire a professional when:
- A consumer monitor shows PM2.5 or VOC readings that stay elevated despite ventilation and source removal
- You suspect CO or radon but want a verified measurement before investing in mitigation
- Mold is visible or a musty odor persists after cleaning
- Symptoms in household members correlate with time spent at home and do not resolve with basic ventilation
- You are buying or selling a home and need documented air quality results
On duct cleaning and HVAC inspection: research on duct cleaning effectiveness shows that professional cleaning removes accumulated particulates and biological material that consumer monitors detect but cannot fix. If your PM2.5 readings are chronically elevated and filter changes do not help, the ductwork is the next logical place to look.
Radon testing is cheap enough that skipping it is hard to justify. If your home has never been tested, a $20 kit from a hardware store is the right first step. If the result comes back above 4 pCi/L, that is when you call a certified contractor.
Why HVAC maintenance directly affects what your monitor reads
Dirty ductwork does not just reduce system efficiency. It actively distributes whatever has accumulated inside the ducts, including dust, mold spores, pet dander, and fine particles, through every room every time the system runs. A monitor in the living room will show PM2.5 spikes that correlate precisely with HVAC cycles if the ducts are contaminated.
NIEHS and EPA research both emphasize that ventilation system maintenance is as important as source control. Sealing a home for energy efficiency without maintaining the mechanical ventilation system trades one problem for another: lower utility bills, higher pollutant concentrations.
The EPA's indoor air quality guidance identifies hidden indicators, such as condensation inside ducts, mold in ductwork, and headaches that resolve when occupants leave the home, as diagnostic clues pointing to HVAC or ventilation failures that professional inspection can confirm.
Signs that duct cleaning or HVAC service is likely the fix:
- PM2.5 spikes correlate with HVAC cycles, not cooking or outdoor events
- Musty odors emerge from supply vents when the system starts
- Dust accumulates on surfaces within days of cleaning, especially near registers
- Allergy or asthma symptoms worsen at home and improve elsewhere
- The system has not been professionally serviced in more than two years
Removing allergens from ductwork breaks the cycle where the HVAC system becomes the primary distribution mechanism for the very contaminants you are trying to reduce. A monitor tells you the problem exists; a professional service addresses the source inside the system.
For homes where HVAC wear is a factor, understanding how system wear affects air quality helps you time service calls before readings deteriorate rather than after.
Key Takeaways
Monitoring the right parameters continuously, then acting on trends rather than single readings, is the most effective approach to protecting indoor and outdoor air quality.
| Point | Details |
|---|---|
| Start with PM2.5, CO, and CO2 | These three parameters cover the highest-risk acute and chronic exposures in most homes. |
| Test for radon separately | Consumer multi-parameter monitors rarely include radon; use a dedicated kit or long-term monitor every two years. |
| AQI above 150 means everyone acts | At AQI 101–150, sensitive groups reduce outdoor activity; above 150, the whole household should limit exposure. |
| Trends matter more than single readings | WHO guidance warns against acting on one number; look for patterns over days and weeks. |
| Airanddryerventcleaningavondale | Professional duct cleaning, HVAC service, and in-home air quality testing in Avondale, AZ address the sources that monitors detect but cannot fix. |
The part most monitoring guides skip
Most articles about indoor air quality monitoring stop at "buy a monitor and check the app." That is useful advice as far as it goes, but it misses the more important question: what are you going to do when the monitor confirms what you already suspected?
The honest answer for most households is that the monitor is not the solution. It is the diagnostic. A PM2.5 reading of 35 µg/m³ at 2 AM, when no one is cooking and the windows are closed, is not a problem you solve by opening an app. It is a problem you solve by finding out why particles are elevated in a sealed house at 2 AM, which usually points to the HVAC system distributing what has built up in the ducts.
The same logic applies to CO2 creep. A well-ventilated home should not see CO2 climb past 800 ppm overnight with two people sleeping. When it does, the issue is not that you need a better monitor. The issue is that the mechanical ventilation is not doing its job, which is an HVAC problem, not a data problem.
Where I think people should actually start: put a CO detector on every floor today, no exceptions. Then get a radon test kit if you have never tested. Those two steps address the two indoor pollutants most likely to cause serious harm before you notice any symptoms. Everything else, the multi-parameter monitors, the AQI apps, the seasonal checks, builds on that foundation. For households with sensitive occupants, add continuous PM2.5 and CO2 monitoring in the bedroom. Then, once you have a few weeks of data, look at the patterns before buying any more equipment or making any structural changes.
When the data points to the HVAC system, that is when a professional inspection pays for itself. Monitoring and maintenance are not separate activities. They are the same health strategy, just at different stages.
Clean air in Avondale starts with what's inside your ducts
If your monitor is showing elevated PM2.5, persistent VOC readings, or humidity that will not stabilize despite ventilation, the ductwork is often where the answer lives. Airanddryerventcleaningavondale provides professional air duct and vent cleaning for residential and commercial properties in Avondale, Arizona, removing the accumulated dust, mold, allergens, and debris that consumer monitors detect but cannot clear.
Services include air duct cleaning, dryer vent cleaning, HVAC filter replacement, vent repair and replacement, and in-home air quality testing with professional-grade equipment. A service visit starts with an inspection that identifies where contamination is concentrated, followed by targeted cleaning and a post-service check. Flexible scheduling, including after-hours appointments, means you do not have to rearrange your week to get it done. To book an inspection or request a quote, visit the Airanddryerventcleaningavondale service page or call directly to schedule.
Useful sources and further reading
The following primary and government sources back the factual claims in this article:
- U.S. EPA: Introduction to Indoor Air Quality — IAQ definitions, ventilation guidance, and pollutant sources
- AirNow: Air Quality Guide for Ozone — AQI bands, ozone health thresholds, and behavioral guidance
- AirNow: Air Quality Guide for Particle Pollution — PM2.5 and PM10 sources, health effects, and action thresholds
- CDC: Air Pollutants — Six criteria pollutants, health effects of PM2.5 and ozone
- NIEHS: Indoor Air Quality — Ventilation, HVAC maintenance, and indoor pollutant concentration drivers
- CPSC: The Inside Story — A Guide to Indoor Air Quality — Indoor pollutant sources, radon testing guidance, and mitigation recommendations
- WHO: Global Air Quality Guidelines (Q&A) — Continuous monitoring rationale and health-based guidance
- National Weather Service: Clearing the Air on Weather and Air Quality — Ozone formation, meteorological effects on outdoor air quality
- Airthings: How to Test Air Quality in Your Home — Consumer monitor capabilities, calibration timelines, and placement guidance
- NASA: What Is Air Quality? — Overview of the six EPA-regulated pollutants and their sources
FAQ
What are the five most important indicators of air quality?
PM2.5, ozone (O3), carbon monoxide (CO), nitrogen dioxide (NO2), and carbon dioxide (CO2 as a ventilation proxy) cover the highest-risk exposures for most households. Radon and humidity round out the list for indoor environments specifically.
How can you tell if your house has poor air quality?
Persistent odors, condensation on interior windows, visible dust near vents, and symptoms like headaches or fatigue that improve when you leave home are the most reliable early signs, as the EPA identifies these patterns as indicators of indoor air quality problems.
What should you look for in an air quality monitor?
At minimum, look for PM2.5, CO2, VOC, humidity, and temperature sensors with continuous data logging and app access. Calibration intervals and sensor accuracy ratings matter more than brand name, and radon requires a separate dedicated detector.
What factors determine air quality?
Pollutant sources (combustion, industrial activity, vehicle exhaust, building materials), meteorological conditions (wind, temperature, humidity, inversions), and ventilation rate all determine air quality. Indoors, HVAC maintenance and air exchange rate are the dominant factors affecting what occupants actually breathe.
When should you hire a professional instead of relying on a consumer monitor?
Call a professional when readings stay elevated despite ventilation and source removal, when you suspect CO or radon, when mold is visible, or when household symptoms correlate with time at home. Airanddryerventcleaningavondale offers in-home air quality testing in Avondale, AZ for exactly these situations.